For better or worse, application performance is one of those things that when managed correctly is a thankless job. However, when issues arise, it’s a nagging pain point for the business, employees, customers, vendors, and many other stakeholders.
For many applications, resolving performance issues simply means throwing additional resources at them, such as CPU and memory. And with the modern lower cost of hardware and applications migrating to the cloud, adding these resources is not a huge burden. But there is this terrible myth in the SAP world that the same can be done to resolve SAP performance problems.
It always pains the best SAP Basis engineers to come into over-architected or under-resourced/utilized systems that are still having performance issues. Yes, these O.S. resources could be the issue, but it’s rare.
Below we’ll review what the SAP technical stack should look like, and pinpoint specific KPIs that should be on every Basis Engineer’s Dashboard.
Operating System Performance
First let’s look at the O.S. resource myth:
Is it possible that there is not enough CPU or memory allocated for proper database or SAP utilization?
Yes, that is a thing…. but really a thing of the past.
Historically when there were performance issues, the O.S. was the first to be blamed as it was hard to disprove and always took a significant amount of time, resources and maintenance outages to physically add more resources to a physical server.
With the advancements to virtual machines and then to the IaaS public clouds, scaling these systems up/down (adding resources to the same server) is now almost immediate.
So if CPU or Memory peaks, additional resources can be provisioned instantly. And when they peak again in 30 minutes, we know it’s something else that’s not configured correctly that’s running away with those resources.
In other words, the high utilization of CPU and memory is often the symptom, not the cause. With that being said, it’s still important to have an eye on CPU and Memory on the dashboards, but it is only one piece of the puzzle.
If you want really detailed installation notes for Avantra, check out the latest version of the Step-By-Step Installation Guide for SAP Basis Engineers.
Networks and Datacenters Performance
Next in the Basis Performance Dashboard, we need to have an understanding of communication between systems and datacenters.
Networks are becoming ever more complex with hybrid environments encompassing almost all organizations. And it may not just be on-prem and IaaS public clouds, but also various SaaS solutions, global datacenters, and many more environments.
Networking is the highway of all of these various data locations. Typically Basis Engineers and Networking teams are not managed under the same group. With that being said, they often utilize different solutions to manage their environments because a Network Engineer doesn’t need to know what’s happening within a SAP environment, and a Basis Engineer doesn’t need to know what’s happening at the network layer.
However, a Basis Engineer should have some basic network KPIs in their toolkit to display in their performance dashboard.
These are typically high level indicators between the production system datacenters and/or cloud hybrid environments, but could be anything from third party interfaces such as vendors and banks, to SaaS solutions and to different facilities and office locations back to the SAP systems.
These high level network performance indicators will instantly identify (where possible) where network performance issues may reside. It could also help identify the confusion as to why specific geographical offices are seeing performance issues and others are not.
Get access to more in-depth content and explainer videos in the SAP Basis Hub >>
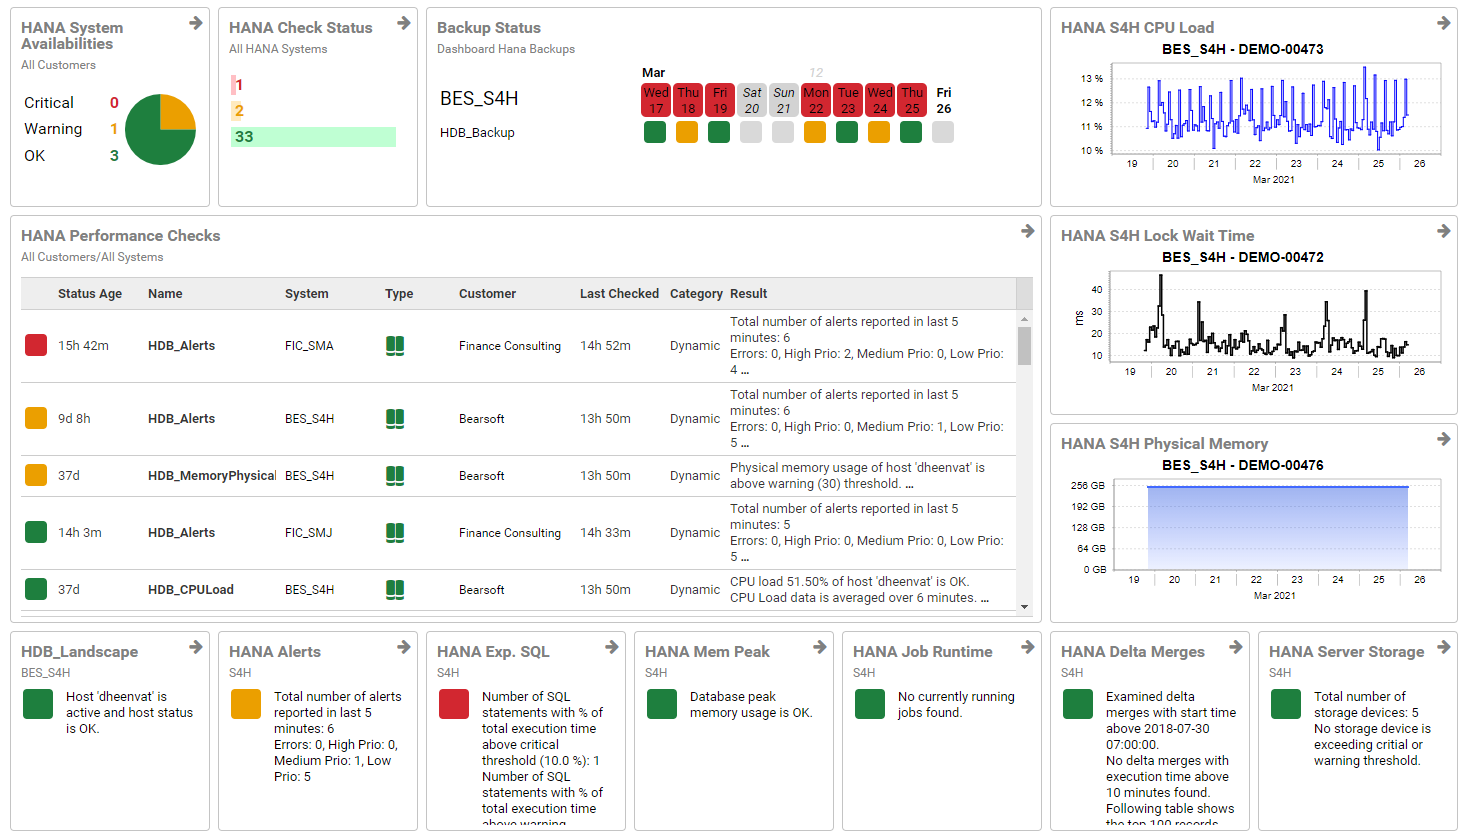
Database Performance
If we head up the technology stack we’ll head into the database. There are a significant number of performance KPIs at the database layer.
Unfortunately there are several databases that SAP can run on, all with their own performance KPIs.
There are thousands of books on how to properly monitor database performance, specific to each database. Therefore, it’s important to have a monitoring solution that has pre-defined performance checks for each of the SAP database types.
At a bare minimum Basis Engineers should consider the following on a database performance dashboard:
- Database memory allocation
- Growth trends
- Indexes,
- write performance
- Monitoring of the logs.
If you are ready to have a play with Avantra, check out how easy it is with the Step-By-Step Installation Guide for Basis Engineers.
SAP Layers Performance
Lastly we move into the SAP layer, and this is where it gets interesting.
Every organization runs SAP uniquely and what is relevant for one organization may not be for another.
Furthermore, each SAP system within an organization will have different performance KPIs depending on what that system is.
For example, one system may be heavily reliant on batch job processing while another is a company portal and it’s all about end user performance.
Everything below may not be relevant to every system – only you will know what’s relevant to your business and your unique environment. But, the following considerations will definitely get you on your way to providing key performance indicators that you can modify to fit your needs.
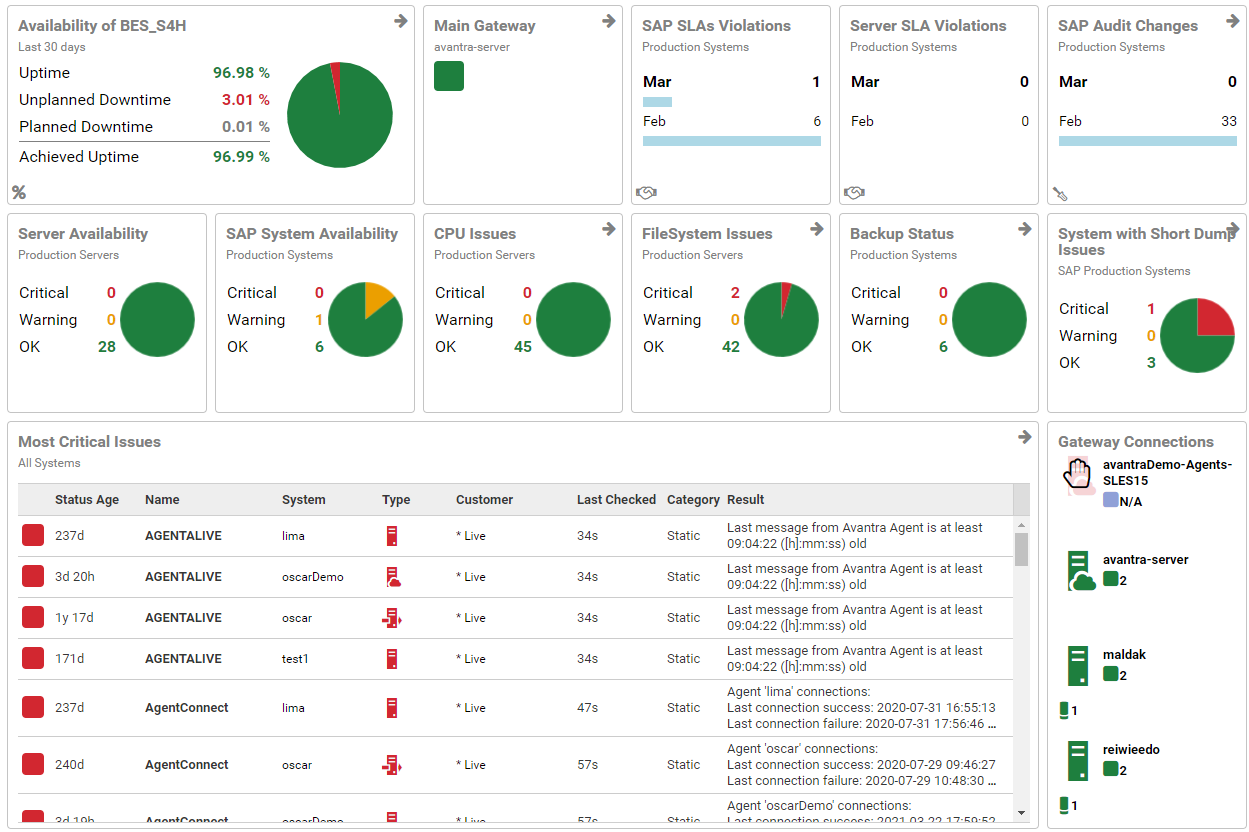
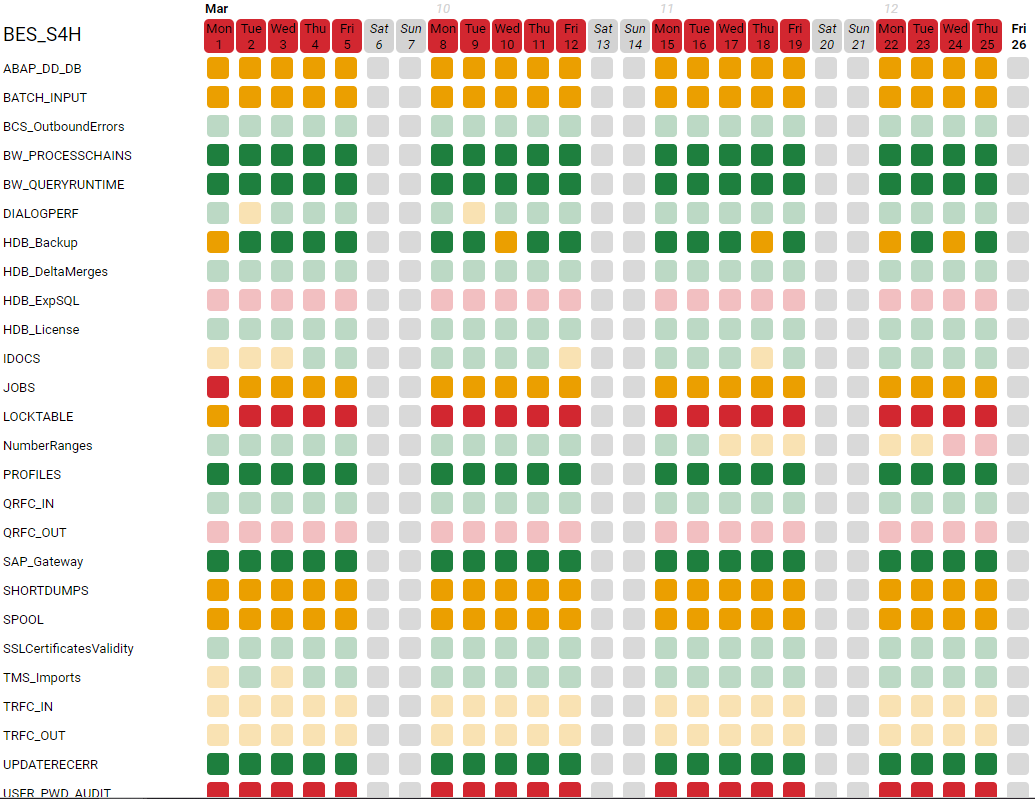
These are all indicators that require a proper SAP monitoring and management solution. No O.S. monitoring solution will be able to provide these details outside of possible generic CCMS (outdated free SAP monitoring) ‘hook ins’.
Expert tip: keep an eye out for OS/network monitoring solutions that say they can do SAP monitoring through CCMS.
- First, we need to look into work processes. If you’re unfamiliar with work processes in SAP ABAP based systems, you may need to do some extra research. Long story short, the work processes are little work engines that every piece of data flowing through a SAP ABAP system utilizes. There are different kinds of work processes and each type can cause the system to either completely freeze or cause major performance delays if they start to fill up. It’s important to not only know if the work process are filling up, but what percentage of status the dialog (end user) work processes are in. This is important because some may be in ‘hold’ or ‘debug’ mode. Also, the CPU time of each dialog work process should be monitored. Should any dialog work process have poor CPU time, an indicator should be shown on a dashboard as well.
- We also want to keep an eye on overarching dialog performance time, which is basically the performance of the end users. This should be done at a general level over the entire system, and also with key, or heavily utilized transaction codes.
- If your system is doing a lot of background processing, it may be important to identify key batch jobs and when they typically run, how long they typically run for and what would happen if they run in parallel with themselves. This doesn’t need to be done for EVERY batch job as there are normally hundreds or thousands of batch jobs in each system. But, there are usually a handful that are important and if these are not running properly they could be the indicator of major issues. It could be the start of a domino effect into greater performance issues, so having these indicators on a dashboard would be hugely beneficial.
- Number ranges may also cause performance issues. Basically, as the system is humming along, different number ranges are continuously being utilized and reused. Not having the number range buffer set correctly could mean wait times and, therefore, performance issues.
- It’s also important to note that performance issues could result from changes to profile parameters. Parameters with too little or too much allocation could result in major issues and even downtime. This is more of an art than a science, as it comes down to how the system is architected. However, knowing when those changes have occurred are indicators that you’d want to have on your performance dashboard. And this doesn’t just go for profile parameters, it could be kernel updates, enhancement packs, and so on. Having an indicator as to how many changes there have been in the last day, week or month, for example, may give you an insight as to why performance issues are happening.
Should You Have a Basis Performance Dashboard?
Overall, performance issues typically don’t just come out of nowhere.
There is usually a culprit and the best way to resolve it should never be throwing more CPU and memory at the system.
Having indicators at the O.S., network, database and SAP layers should all be part of making a Basis Engineer’s life easier. If you can easily identify where an issue is occurring, can hopefully correct it before it becomes a major problem with consequences.
The above performance area are some of the general, overarching indicators. But, there are plenty more that can and should be made available to Basis Engineers, but this is when it starts to get really specific to your personal environment.
I hope this has been a useful guide to which indicators of performance you should include in your Basis Performance Dashboard. If you’d like to have a chat about any of these areas, or how to tackle your unique set-up, please reach out to me and I can try to help.
In the meantime, check out the demo videos in the SAP Basis Hub. Enjoy!